The Universe: a time-travel map
The most complete 3D map so far produced. Published on 20 July 2020, it goes back to the early days when the Universe was less than 3 billion years old. And a new map, with added details, is already on the way…
Investigation by Barbara Vignaux - Published on , updated on
In the field of science, answers to old questions frequently raise new ones. This is true of the 3D map of the Universe produced by hundreds of astrophysicists from all over the world after twenty years of data collection and analysis. Enhanced methodology, millions of celestial bodies catalogued, hundreds of articles, thousands of pages of scientific literature, startling conclusions about cosmological history: that is the heritage of the unprecedented cartographical venture. But the legacy of two still unsolved mysteries remains. As researchers observed the celestial sphere, they were able to look back far into the past and suggest a new value for the expansion rate of the Universe. However, it was inconsistent with the figure produced by other calculation methods. And while their observations confirmed the existence of an enigmatic ‘dark energy’, they did not explain its nature. All these conundrums are to be elucidated by future space-mapping projects…
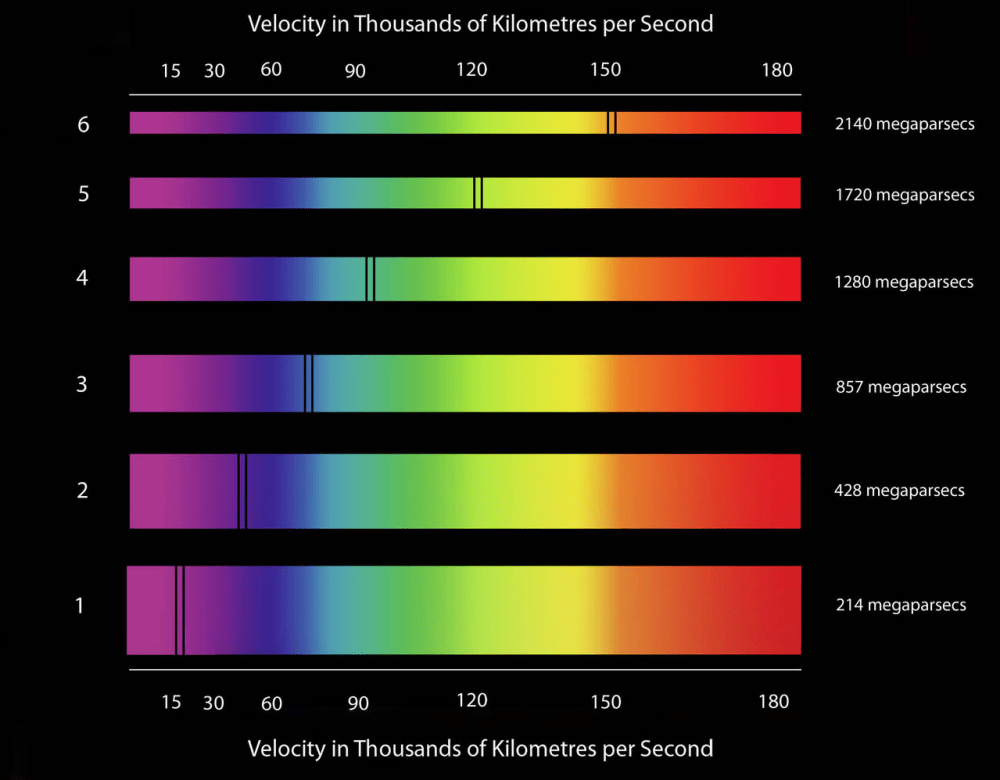
Measuring distances: red shift
To estimate a body’s distance from the Earth, scientists measure red shift, a distortion of light comparable to the Doppler effect for sound: the light of a body shifts towards blue if it is approaching and red if heading away. According to Hubble’s law from1929, the shift is proportional to distance: it ranges from 0 for neighbouring galaxies to 3 for the most remote quasars. Here, the reference used by the astrophysicists – the vertical double black line which is the chemical signature of the body examined – shifts to red (towards the right) with distance (increasing from bottom to top).
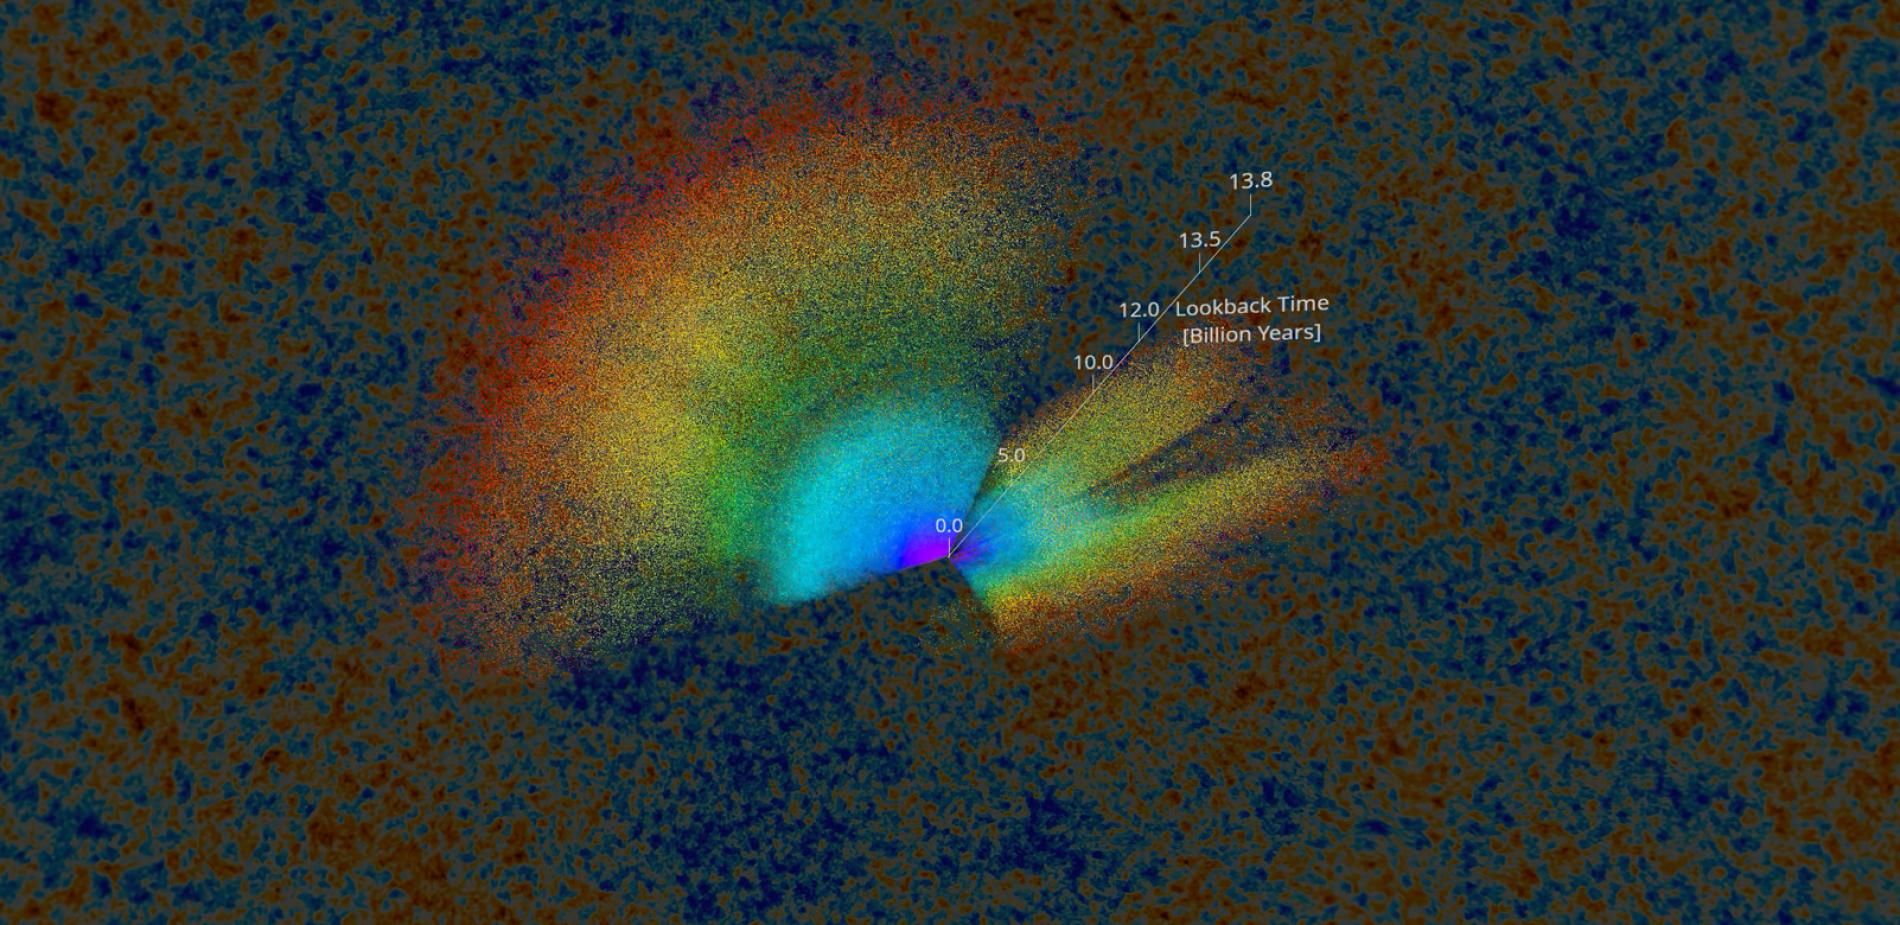
The most complex map of the Universe
Four million objects are shown on this 3D map of the Universe.
Hundreds of astrophysicists all across the world worked for twenty years. They patiently accumulated and analysed the data from series of observations made using the Sloan Foundation telescope at the Apache Point Observatory in New Mexico, examining the most distant objects in the Universe. Their very detailed research was named the SDSS (Sloan Digital Sky Survey), BOSS (Baryonic Oscillation Spectroscopic Survey) and finally eBOSS (extended BOSS). Finally, on 20 July 2020, the scientists published a map of the Universe that included four million blue and red galaxies, quasars and cosmic voids. Each of the bodies is positioned in a field – the celestial sphere – using a pair of coordinates, ‘X’ and ‘Y’. However, the innovative aspect of the project is that it locates the bodies according to their ‘depth’, using red shift measured by an optical instrument linked to the telescope, a spectrograph that disperses the colours of light and then records the resulting spectrum. The greater an object’s red shift, the further it is from the Earth and the longer ago its light was emitted. Between 2014 and 2019, the last of the surveys, eBOSS, looked at objects with a very high red shift, such as quasars. In so doing, it revealed very distant, still unexplored regions of the Universe and therefore an obscure chapter in cosmological history covering a period from 6 to 11 billion years ago, the Universe itself being 13.7 billion years old.
A dedicated telescope
Brought into service in 2000, Sloan is an American telescope located at Apache Point in New Mexico. It is a wide-field instrument, meaning it covers a broad section of the sky. And it is ‘dedicated’, reserved for a precise task: mapping the cosmos. Combined with its spectrograph, it can carry out a thousand measurements at once and identify the positions of celestial bodies in 3D. On moonless nights, it is used to observe the dimmest objects, such as distant quasars. At other times, it examines objects that are nearer and therefore brighter – the stars of the Milky Way, for example.

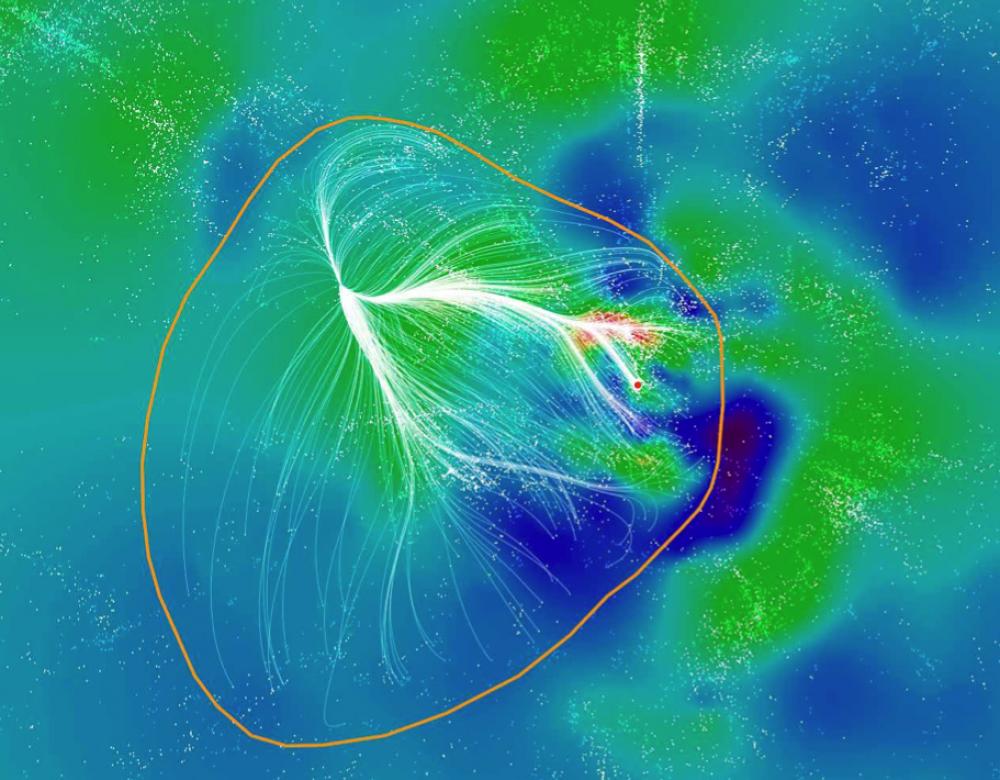
Laniakea, our local supercluster
Mapped by a team of astrophysicists in 2014, Laniakea is the ‘celestial supercontinent’ that contains the Milky Way (the red dot on the map). The extremely dense cluster spans 500 million light years (ly). In comparison, the Milky Way is 100,000 ly across. Laniakea holds 100,000 galaxies comparable to ours, each with 100 billion stars. So it is a colossal cluster, but tiny on a cosmic scale: less than 4% of the observable Universe! The BOSS and eBOSS surveys began beyond the supercluster, looking at galaxies 1 to 1.5 billion ly away.
Views of the past
The map enables a reconstruction of cosmological history going back as far as 11 billion years.
A photon emitted by a light source one light year away from Earth has travelled 10,000 billion kilometres in a year to reach us. So the further we look into space, the further we go back in time. Consequently, the 3D map shows us the Universe at different stages in its history, back to 11 billion years ago (i.e. 2.7 billion years after the Big Bang). And, especially, distant quasars, the prodigies of the latest survey (eBOSS): supermassive black holes of tens of millions or even billions of solar masses! They are true colossuses compared to the black hole at the core of the Milky Way: ‘only’ 4 million solar masses. There are also ‘emission-line’ galaxies. Even distant ones are relatively easy to observe because they include many stars in formation, which means the light they emit has a special ‘spectral signature’ (the breakdown of light into wavelengths). Large numbers of these galaxies 6 to 8 billion years ‘old’ will be mapped by the DESI project, the successor to Sloan: 17 million compared to 300,000 today. Finally, this great trip back in time has enabled researchers to extend our knowledge of cosmological history: while the expansion of the Universe initially slowed for more than seven billion years, it has accelerated for the last six billion. What force ‘distancing’ cosmic bodies from each other can explain this accelerated expansion? For lack of a precise answer, scientists call it ‘dark energy’.

Quasars and hydrogen clouds
Because of the extreme brightness of quasars, it is possible to go back further than 6 billion years, to before the formation of our Solar System. Colossal accretion disks form around quasars, releasing powerful bursts of light. They are observed indirectly: in front of the quasars are rarefied intergalactic clouds of hydrogen that cast shadows, like ships whose shapes appear against the halo of a lighthouse. After their location by the SDSS survey, these images captured by the Hubble space telescope show ‘post-starburst’ quasars, revealing surges of star formation.
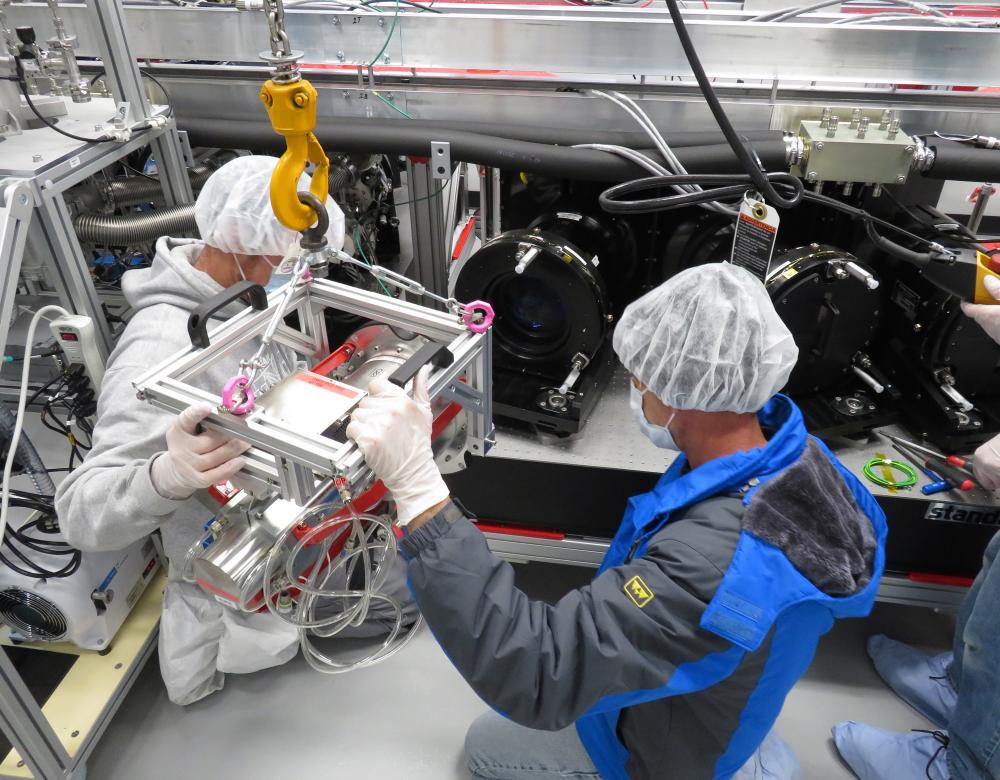
The French: spectrography experts
French research played a very important role during the final stages of production of the cosmic map, especially in terms of the analysis of data from the BOSS (2009–2014) and eBOSS (2014–2019) surveys. The laboratories involved were Irfu (CEA), LAM (CNRS/AMU/Insu), IAP (CNRS/Insu), CPPM (CNRS/In2p3) and LPNHE (CNRS/In2P3/Paris-Diderot). In fact, seven French scientists were among the initial authors – and main contributors – of the twenty or so scientific articles that appeared in July 2020 when the map was published. French researchers have also participated in the construction of the spectrograph for the DESI project, Sloan’s successor: here at CEA Saclay.
A controversial expansion rate
Among the great challenges of contemporary astrophysics is the identification of Hubble’s constant, still a subject of debate.
Measuring the expansion rate of the Universe – named ‘the Hubble constant’ after the American astronomer Edwin Hubble (1889–1953) – tells us more about the history of the Universe, but also lets us make better predictions about its future. For a number of decades, there have been sophisticated calculations of its value, but no specific figure has gained a consensus. Roughly speaking, there are two opposing ‘schools’. The first approach is known as ‘the distances of nearby objects’. It is based on the observation of Cepheid stars (giant variables) and supernovas (exploding stars). The second method is based on data supplied by cosmic background radiation, i.e. the remains of the oldest light in the cosmos. These data can be combined with information collected by the Sloan telescope, which covers 80% of the history of the expansion of the Universe, including an older, formerly obscure period (from 6 to 11 billion years). Using this approach, physicists have calculated a value 10% lower than the one suggested by the first ‘school’. There seems to be no reason to believe this discrepancy comes from the data collected: they are extremely precise. So is there a problem with their interpretation? Or is the underlying cosmological model wrong? With a more precise, plentiful mass of data than that gathered by Sloan, its successor, the DESI project, will try to solve the mystery.
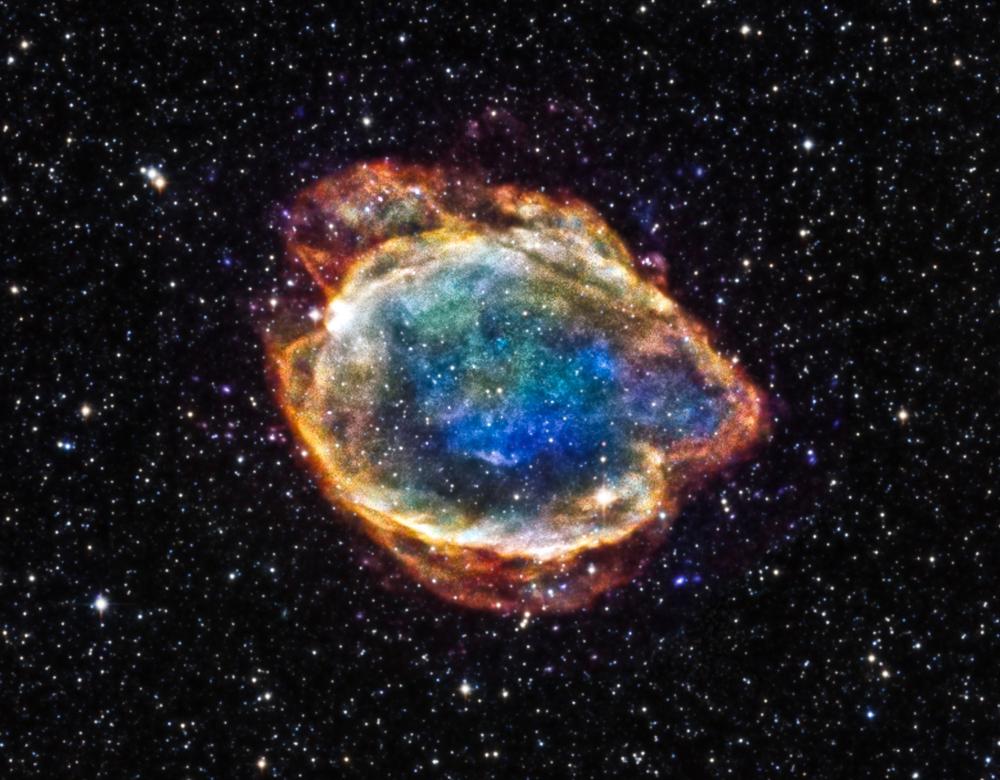
Dark energy … for want of a better hypothesis
Identified in 1998 by the observation of supernovas (photo), the acceleration of the Universe’s expansion was explained – for want of a better theory – as resulting from the ‘repellent’ quality of dark energy. Dark energy is an unknown, never observed component of the Universe, but still compatible with Einstein’s General Relativity. However, we have yet to discover its precise nature: that is one of the great challenges for contemporary physics. Meanwhile, the map shows that for the last six billion years, its effect has been stronger than that of the familiar force of gravity, which attracts objects to each other and slows the expansion of the Universe.
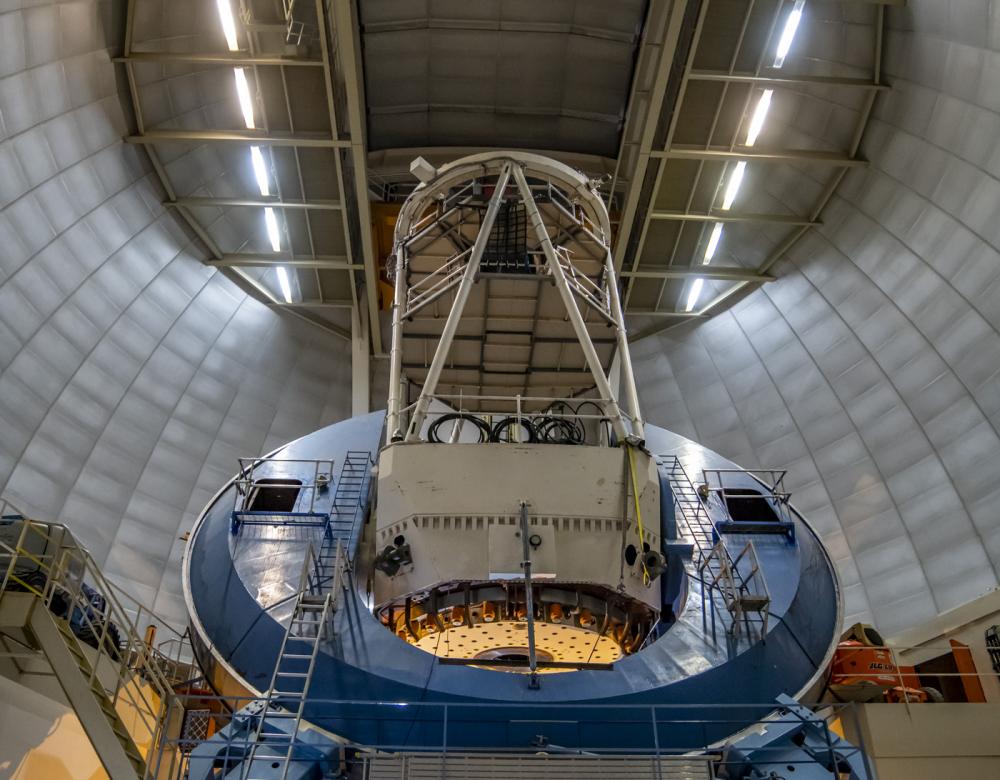
A clearer map from DESI
Installed on the 4-metre Mayall telescope in Arizona, DESI (Dark Energy Spectroscopic Instrument), the successor to Sloan, came into service in 2020. It is able to simultaneously observe 5,000 objects in the ultraviolet, visible and infrared wavelengths, compared to a thousand for Sloan, using thousands of ‘robots’ that select objects to be analysed. So DESI (photo) will be able to map 30 to 50 million objects over five years, compared to 4 million in twenty years for the Sloan surveys. The data will be analysed by nearly 500 researchers from 75 organisations in 13 countries, including the CEA and CNRS in France.
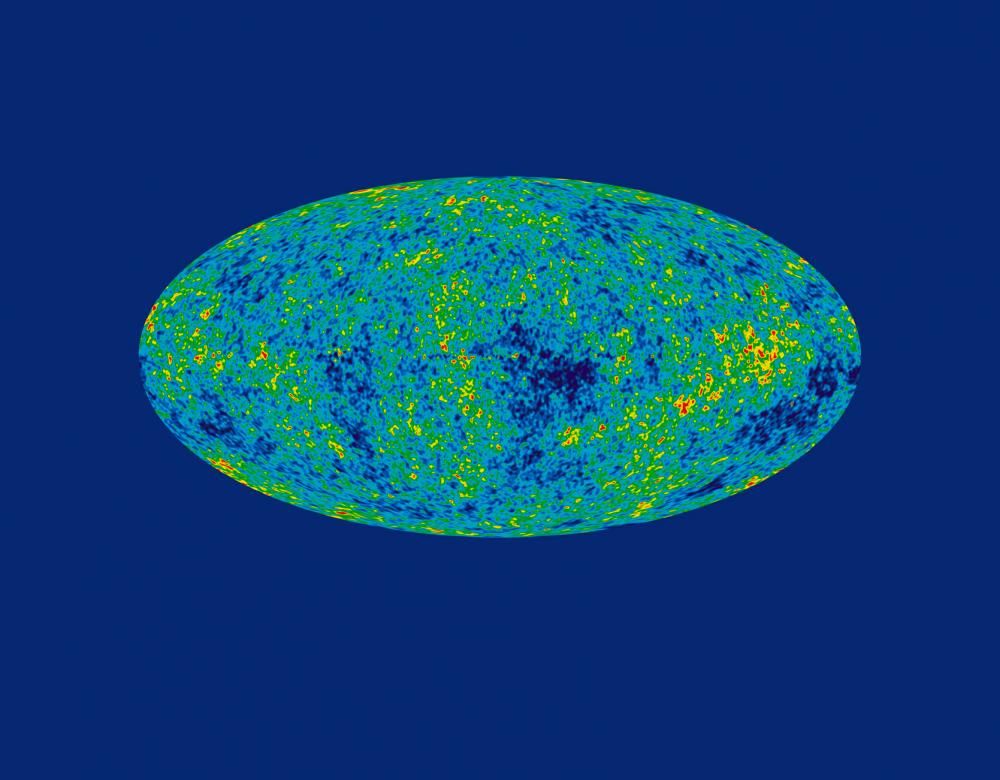
Back to the origins of the Universe
Using the data to be obtained by DESI and, later still, the Euclid and James Webb space telescopes, astrophysicists hope to learn about the first two billion years of the history of the Universe, i.e. the ‘missing link’ between two points: the current limit of the eBOSS map 11 billion years ago, which is the location of the Lyman-alpha forest (the most distant intergalactic environment), and cosmic background radiation (picture), i.e. the fossil remnants of the radiation that filled the Universe 380,000 years after the Big Bang.