1. Diagnosis of warming
‘The Climate Question(s)’ explores all the questions raised by climate change due to the increase in greenhouse gas emissions linked to human activity. It also provides a better understanding of the climate system, with researchers’ latest observations, simulations and analyses.
Chapter 1 of ‘Climate in Question(s)’
Isabelle Bousquet - Published on , updated on
Meteorological Stations, Tide Gauges, Floats drifting in the oceans and satellites are all used to monitor changes in the Earth’s climate… and show us that the Earth is warming. This warming is already having observable consequences – for instance, the melting of the Arctic ice pack and the retreat of most continental glaciers. Is this something new in our planet’s history? To answer that question, climatologists are examining all natural climate records in the environment: ice cores, cores of marine and lake sediments, rings in tree wood, coral reefs, grains of pollen and so on. Their conclusion is that different natural factors have increased the temperature of the Earth’s climate in the past. It was heavily warmed by a strong greenhouse effect in the Eocene Epoch 60 million years ago and then in the Pliocene Epoch about million years ago. However, the kind of warming observed over the last thirty years has never happened before in the past 1,500 years, particularly given its global nature and initial impacts.
Climate Is Not The Same Thing As Weather!
Climatology, with its long time scale and the many processes it involves, is very different to meteorology.
Meteorology describes the state of the atmosphere at a given moment in a specific part of the world, along with changes that can be forecast a few days ahead. Regional climatology though, considers meteorological conditions as a whole over a long period (at least thirty years). So climatologists work in the long term – unlike meteorologists, who make short-term predictions, examining the average values of atmospheric parameters: air temperature, precipitation, atmospheric pressure, the force and direction of winds, etc. More generally, on a global scale, climate is primarily defined in terms of energy. The Earth is warmed by solar energy, and climate – or rather what we call the ‘climate system’ – redistributes the flow of solar radiation on the surface of the Earth. The state of the Earth’s climate depends on the balance between energy received from the Sun and energy radiated back into space. Any disruption of this balance leads to a change in the Earth’s climate. Factors that disrupt the equilibrium are known as ‘forcing mechanisms’. These can be natural (for instance solar and volcanic activity) or anthropogenic, i.e. resulting from human activity. Current global warming results from an accumulation of energy in the climate system, 93% of which is absorbed by the oceans, 3% the land, 3% ice and 1% the atmosphere.

Global Monitoring
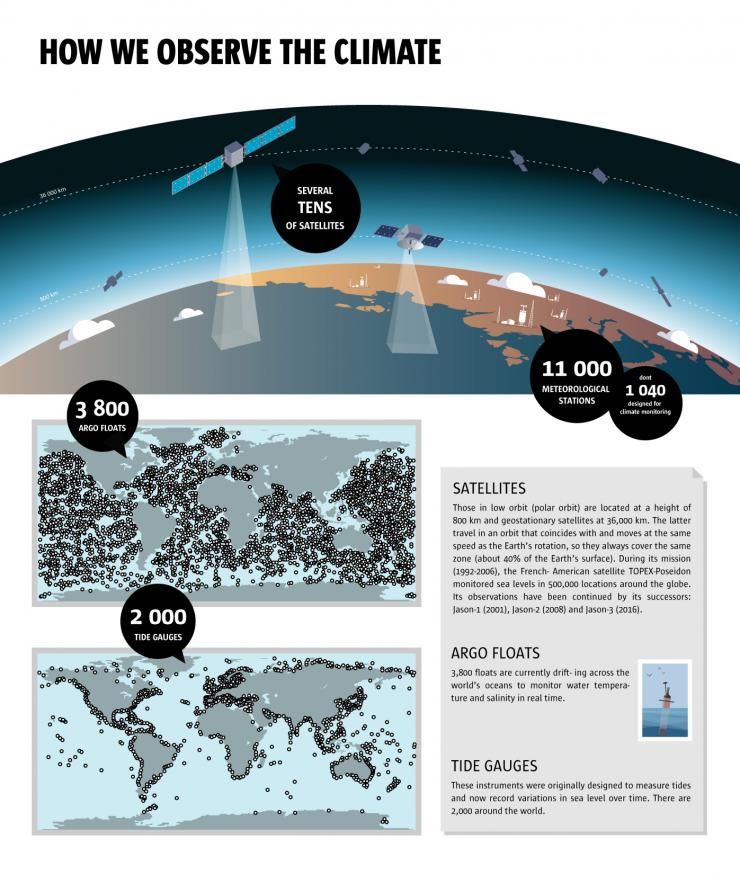
Meteorological stations, tide gauges, floats drifting in the ocean and satellites are all used to monitor changes in the Earth’s climate.
Meteorological stations, tide gauges, floats drifting in the ocean and satellites are all used to monitor changes in the Earth’s climate. To observe the Earth’s climate, major global meteorological and oceanographic measurement networks have been set up over more than a century. Using standardised measuring instruments, they record physical parameters such as air temperature, pressure and humidity, and the salinity of seawater. For the last forty years, satellite climate monitoring has complemented the information provided by these measurement networks. Satellites supply data on the temperature of the atmosphere and oceans at sea level, patterns of precipitation and cloud, the varying size of the ice caps and their estimated mass, etc. Dozens of these satellites, as well as 11,000 meteorological stations and nearly 6,000 tide gauges and drift floats in the ocean are used to gather information. This coordinated global operation has grown over time. It was initially designed to forecast the weather but was then developed to monitor climate. One of the indicators of climate change is the year-on-year monitoring of changes in the average temperature on the Earth’s surface, which is around +15°C. Estimation of this temperature is based on the combination of data which have no uniform temporal or spatial coverage, given the lack of measurement stations in certain regions and changes in instrumentation over time. To homogenise all this information, climatologists use complex statistical procedures.
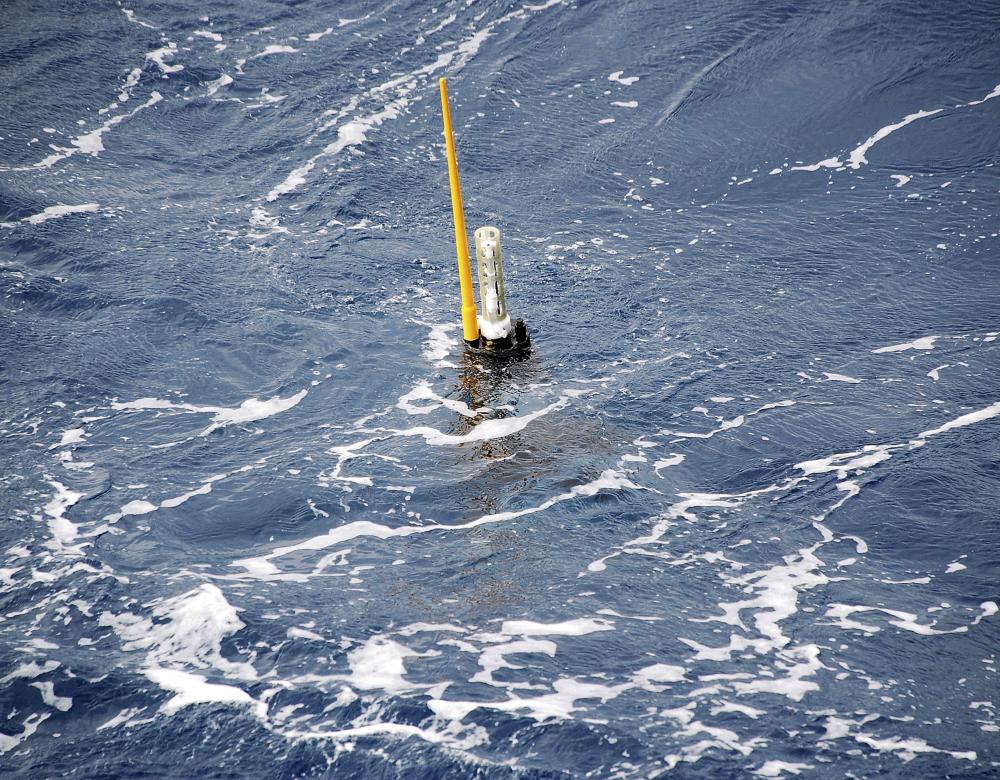
Ever Deeper In The Oceans
Since the 1990s, the automated measurements made by floats drifting in the ocean (Argo floats) have been added to observations made by oceanographic research vessels. To improve the monitoring of sea currents – which have an impact on climate, new floats that are currently at the trial stage in France, the USA and Japan will enable study of the ocean depths down to 4,000 or even 6,000 metres.
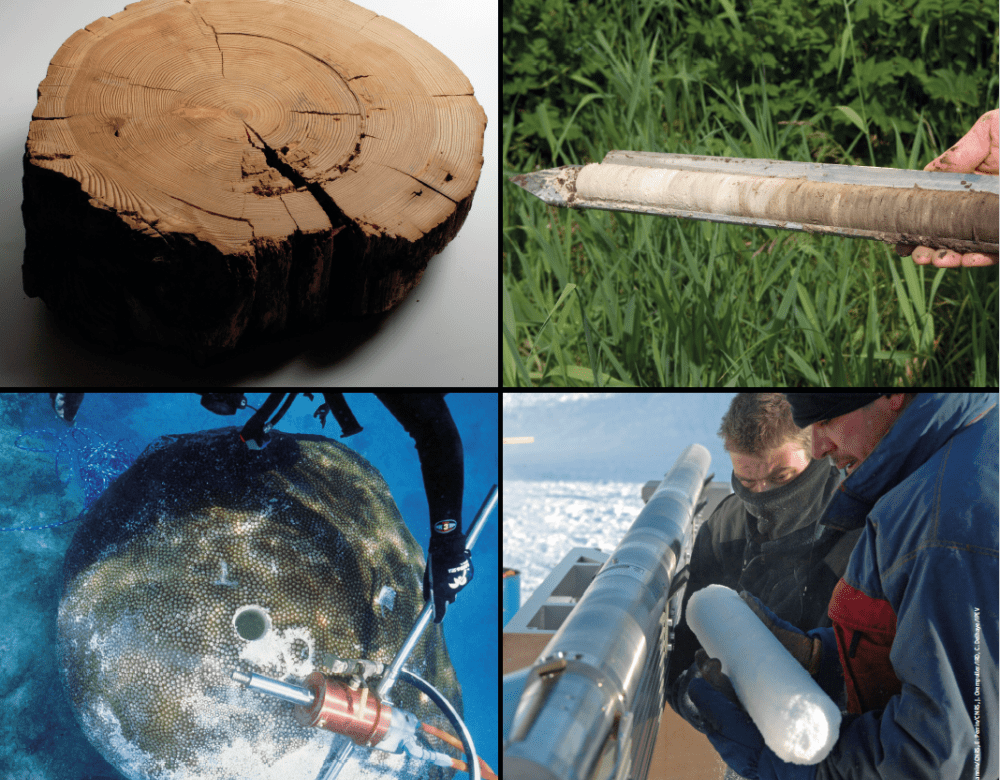
Millennial Archives
Marine and lake sediments, ice, tree rings and coral reefs all retain a record (in their physicochemical composition and structure) of the prevailing climate conditions (temperature, rainfall, salinity, etc.) when they were formed. By analysing and dating samples from these natural archives, palaeoclimatologists can ‘reconstruct’ climate change in the past, site by site and then region by region. Their conclusion is that temperatures in the northern hemisphere have varied little (less than 2°C) over the last two millennia.
A Planetary Heatwave!
The Earth is getting warmer with already visible consequences, such as the melting of the Arctic Ice Pack, the retreat of glaciers and a rise in sea levels.
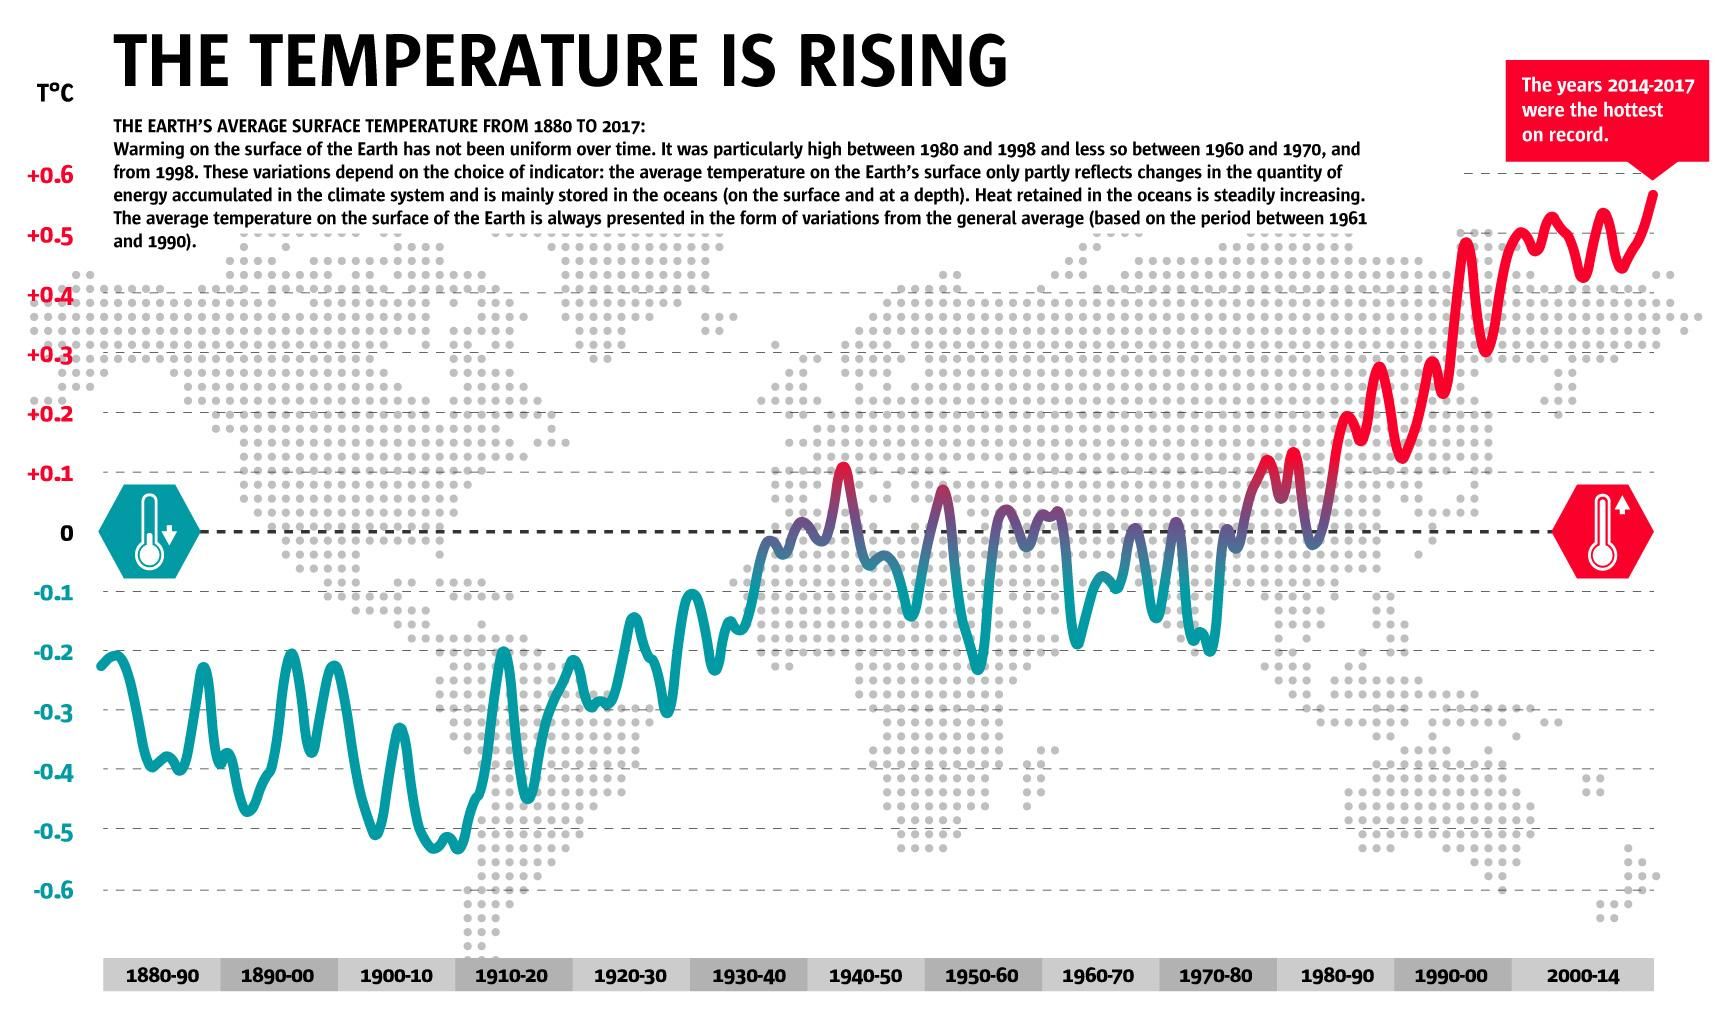
+0.9°C : this was the increase in average temperature over the surface of the Earth (continents and oceans) between 1880 and 2017. The climate is warming generally, but not uniformly: the Northern Hemisphere is affected more and warming is greatest in high latitudes (the Arctic) and higher on the continents than in the oceans. This is already having different effects on the environment. The most striking of them is the melting of the Arctic Ice Pack in summer, reducing both its surface and thickness. Generalized shrinkage of glaciers in tropical, temperate and Polar Regions can also be observed. Measurements provided by Tide Gauges and Satellites show a rise in sea levels of 3 millimeters a year over the last twenty years. As it warms, the water in the oceans expand. This, together with the melting of continental ice (mountain glaciers and the ice sheets of Greenland and the Antarctic), is causing rises in sea level. Other signs of global warming include the migration of certain species such as Pine Processionary Caterpillars, which are heading up towards the north of France, or Greylag Geese, which are increasingly wintering in France rather than migrating to Spain or Africa. Some fruit trees are also blossoming earlier. Finally, in many regions of the world, the average number of days of frost each year has fallen and the number of hot days (a temperature higher than 25°C) has increased since 1950 (by more than 50% in Paris). Finally, in many regions of the world, the average number of days of frost each year has fallen and the number of hot days (a temperature higher than 25°C) has increased since 1950 (by more than 50% in Paris).

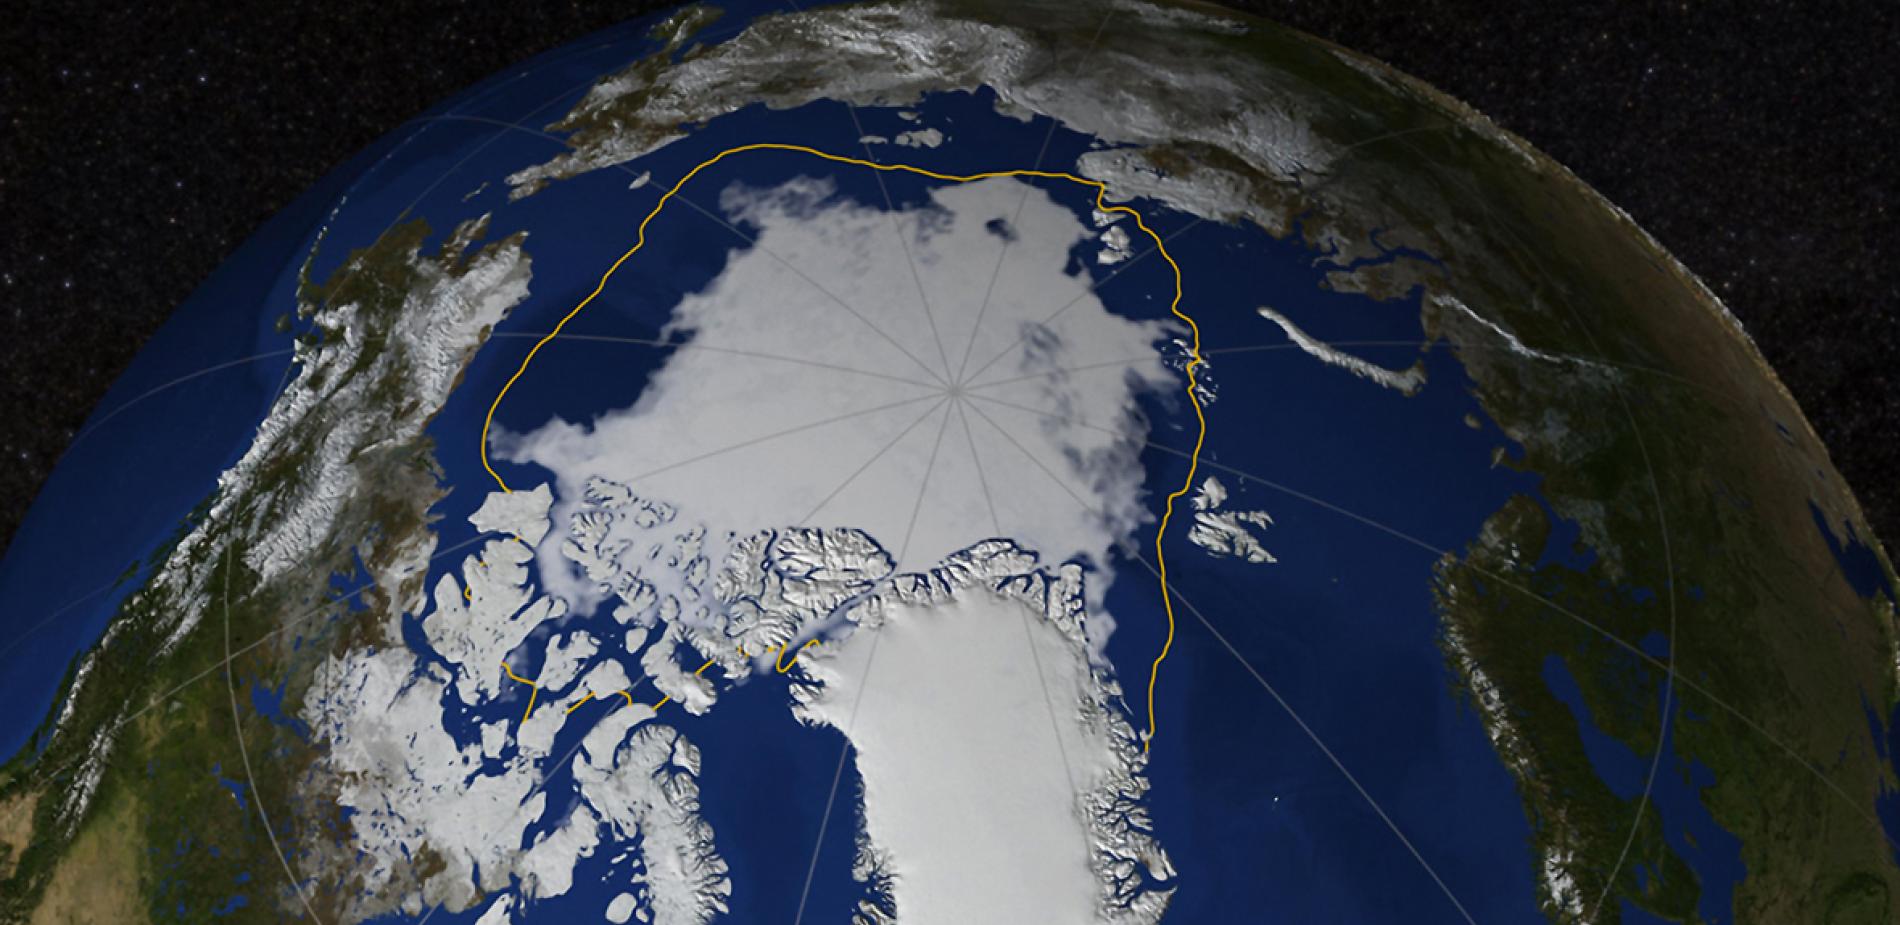
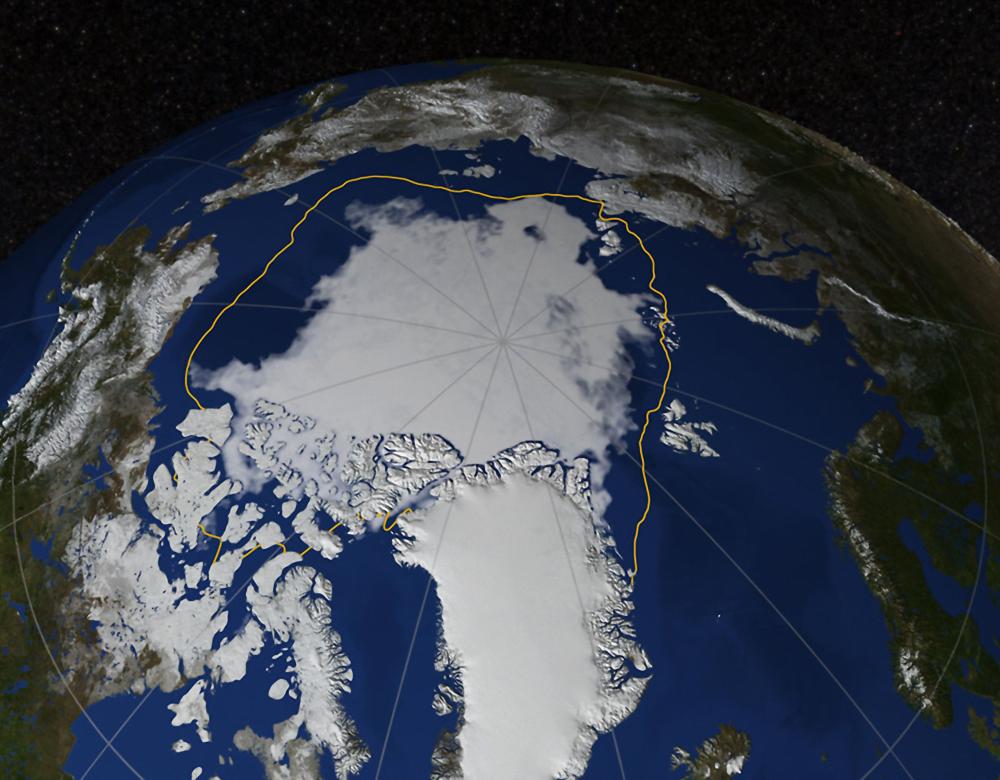
Will The Arctic Ocean Soon Be Ice Free?
Since satellite monitoring of the Arctic ice cap began in 1979, its surface area, measured every September, has shrunk by 10% on average every decade. In addition, historical data shows that the warming observed over the last century is three times greater in the Arctic than in the rest of the world. According to certain hypotheses, the Arctic Ocean ice pack could disappear totally in the summer months from 2050 on. The situation is less clear-cut in the Antarctic at the South Pole, where ice has been melting on the Peninsula and in the west of the continent (since the mid-20th century), but the ice cap is tending to spread.

Glacial Retreat
With the exception of certain glaciers (Karakorum) in the Himalayas, most continental glaciers are shrinking in volume. In France, La Mer de Glace retreated by 1.8 km between 1823 and 1995 with a loss of 700 m from 1993.
Unprecedented Warming?
The Earth’s climate has already experienced periods of warming in the past, but if we look at the last 1,500 years, the current episode is unique.
To decide whether current global warming is unprecedented, we need to look at climate records spanning long periods of time. Palaeoclimatologists, i.e. scientists who study the history of climate, can refer to a number of natural climate records. By analysing sea sediments, they can build a picture of variations in sea level and temperature in the oceans over more than 60 million years. Core sampling in the Antarctic ice sheet shows variations in the polar climate and the makeup of the atmosphere (based on air bubbles trapped in the ice) for the last 800,000 years. Sediments in lakes and cave concretions provide information about climate change over thousands to hundreds of thousands of years. For the last millennia, data recorded season after season in the rings of trees or in coral play a valuable role. All these indicators show that the Earth’s climate has changed many times in the past because of different natural factors. Continental drift has impacted on climate over a period of millions of years; variations in the Earth’s orbit over millennia. Solar activity and volcanic eruptions also play a part in natural climate variation. Even so, climate warming over the past thirty years has been unique in the last 1,500 years, especially in its global nature and initial impact.
This dossier is the online version of “Climate. The 360° exhibition” presented at the Cité des sciences de l’industrie in September 2015 on the occasion of COP21, with the support of the BNP Paribas Foundation. The contents were updated in 2018.
